A 38 North exclusive with analysis by Joseph S. Bermudez Jr., Mike Eley, Jack Liu and Frank V. Pabian.
Summary
Thermal imagery analysis of the Yongbyon Nuclear Scientific Research
Center indicates that from September 2016 through June 2017:
The Radiochemical Laboratory operated intermittently and there have
apparently been at least two unreported reprocessing campaigns to
produce an undetermined amount of plutonium that can further increase
North Korea’s nuclear weapons stockpile. This suggests batch rather than
continuous processing of spent fuel rods from the 5 MWe Reactor during
the period of analysis.
Increased thermal activity was noted at the Uranium Enrichment
Facility. It is unclear if this was the result of centrifuge operations
or maintenance operations. Centrifuge operations would increase the
North’s enriched uranium inventory; however, based on imagery alone, it
is not possible to conclude whether the plant is producing low or highly
enriched uranium.
The thermal patterns at the probable Isotope/Tritium Production
Facility have remained consistent, suggesting that the facility is not
operational, or is operating at a very low level. This means, the
facility is likely not producing tritium, which is an essential isotope
used in the production of boosted yield nuclear weapons and hydrogen
bombs.
From December 2016 through January 2017, the thermal pattern over
the Experimental Light Water Reactor (ELWR) was elevated. While that
might indicate that the reactor was operational, the likelihood is low
since the pattern does not appear in subsequent imagery over the last
six months. It is possible that there are alternative explanations for
the elevated pattern, for example, short-term activity at the ELWR such
as the heating of pipes to prevent freezing. Regardless, any activity at
the ELWR is cause for concern and bears continued monitoring.
The 5 MWe Reactor has either been intermittently operating at a
low-level or not operating. The notable exception to this was during
December 2016 and January 2017 when thermal patterns suggests a higher
level of operations.
Analysis
While commercial satellite imagery is now widely used to analyze
important developments overseas, including in North Korea, thermal
imagery can provide additional important insights. Landsat 7 imagery
from September 2016 through June 2017 was used for this analysis,
although heavy cloud cover precluded the use of imagery from last
November and no night-time imagery was available for the entire time
period of this study.[1]
A total of 19 images are available and of these, 10 were chosen with
approximately one-month time intervals between them to provide a
consistent periodicity for the analysis. Seven images were deemed too
cloudy for analysis and thus weren’t considered.[2]
Developments noted at key Yongbyon installations were as follows: Radiochemical Laboratory: Examination of the thermal
patterns associated with the Radiochemical Laboratory (reprocessing
facility) show significant deviations from month to month. Concentrated
heat patterns were observed with stronger temperature differences from
the surrounding area between September to October of last year. The
thermal patterns then returned to lower levels until March 2017, when a
distinct increase in thermal activity is observed that has continued
through last month. These intermittent surges in thermal activity
suggest North Korea has conducted batch rather than continuous
processing of spent fuel rods from the 5 MWe Reactor. It is typical to
allow the spent fuel rods to rest for a while in cooling ponds to both
cool and allow less stable plutonium isotopes (PU-238, etc.) to bleed
off. These reprocessing campaigns do not necessarily occur immediately
after spent fuel rods are removed from the 5 MWe reactor. The June 2017
thermal activity coincides with an increase in activity noted in a March 2017 analysis based upon natural color imagery. Uranium Enrichment Plant: The thermal patterns at
the Uranium Enrichment Facility were elevated during September and
October 2016, then decreased in November 2016 and remained low until
March 2017 when it increased slightly. It is unclear if the period of
elevated activity from September through November was related to
centrifuge operations or the maintenance activity that was observed during this period. Experimental Light Water Reactor: The same elevated
thermal patterns over the 5 MWe Reactor observed in imagery during
December 2016 and January 2017 also extended over the area of the ELWR.
This was likely the result of steam being released into the air when the
turbines adjacent to the 5 MWe Reactor were being run, operation of the
5 MWe Reactor itself, mid-winter heating of both structures, prevailing
weather patterns, or some combination of the above. We cannot
completely, however, eliminate the possibility that this elevated
thermal pattern was the result of short-term activity at the ELWR
itself—for example, heating the structure to prevent pipes from
freezing, allowing ongoing internal construction work, or pre-startup
testing.[3]
It is important to note that no other significant patterns of thermal
activity were observed over the ELWR throughout the study period.
Importantly, the ELWR did not operate at all from February through June
2017. Any activity at the ELWR is cause for concern and its operational
status bears continued monitoring as it would be an indicator of North
Korean ongoing intentions and capabilities. 5 MWe Reactor: The thermal patterns observed at the 5
MWe Reactor remain relatively consistent with those observed in the
previous report indicating either intermittent low-level or no operation
of the reactor. There was a notable deviation in the December 2016 and
January 2017 images, suggesting a period of higher level reactor
operation that lends support to a previous analysis based upon natural color imagery. Isotope/Tritium Production Facility: The thermal
patterns at the probable Isotope/Tritium Production Facility have
remained consistently low throughout the period under study, suggesting
that the facility is not operational, or is operating at a very low
level.
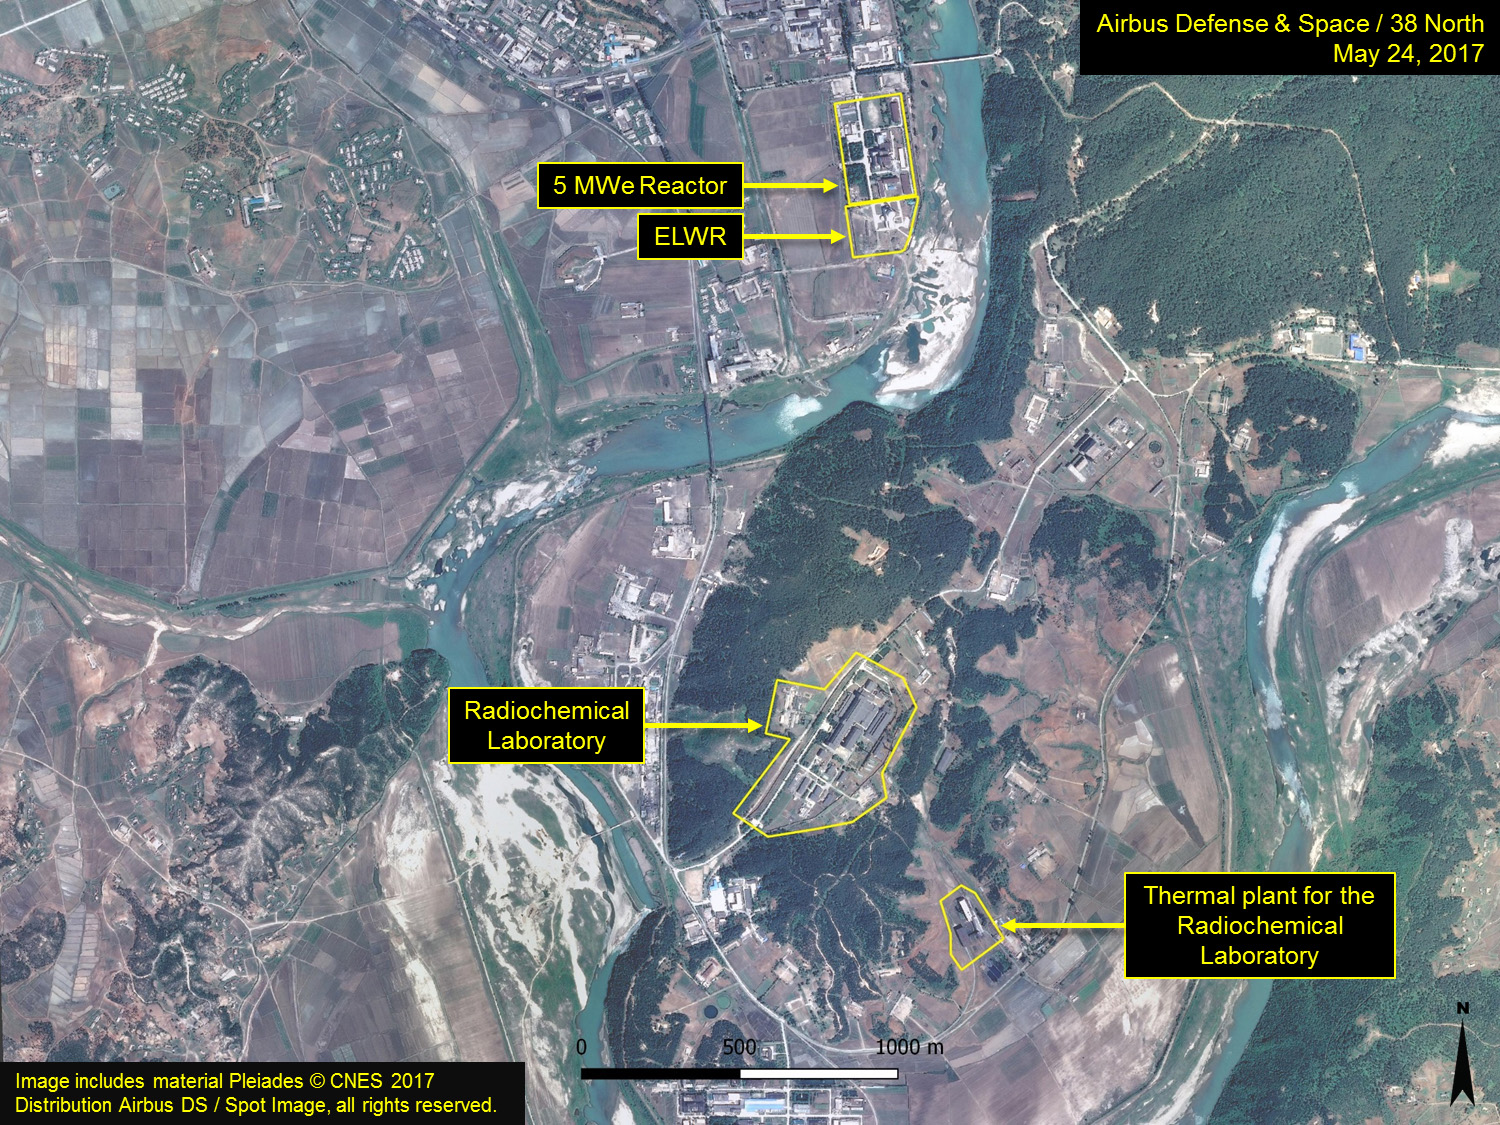
Figure 1. Overview of the 5 MWe Reactor, ELWR and Radiochemical Laboratory (reprocessing facility).
It
is important to understand several limitations when using Landsat 7
thermal imagery for this type of analysis. Among these is that the data
is collected at 60 meters ground sampling distance (GSD). That is, each
pixel represents 60 meters. It is then resampled down to 30 meters GSD.
Additionally, the Landsat 7 thermal sensor is measuring both the thermal
response of the ground plus the air column above it. It is not
unusual for a prevailing wind, which over Yongbyon at this time of
year, generally originates out of the northwest or north, to carry the
heated air column from one point to another (e.g., the 120-150 meters
from the 5 MWe Reactor over the ELWR). In the current and previous 38
North thermal studies, we are pushing Landsat data to its limits.
Typically,
a reactor would be loaded and started up at low power to heat and
pressurize the coolant and adjustments would be undertaken to balance
the pressure and flow through the system. Once operators are assured
that the settings are correct the system can then be operated at full
power. Once reactor operations commence, there is a requirement to
continuously cool it to remove heat, even if it is only from radioactive
decay. If a reactor has started up and subsequently shut down after a
short period of low-level operation, the residual heat removal system
would not need to remove significant heat because the core would be new.
That heat is carried away by cooling water and never gets into the air.


Keine Kommentare:
Kommentar veröffentlichen